These daily summaries are grouped together weekwise and are presented below. Complete details of the data collected from different instruments are available at http://www-indoex.edu/
INDOEX – FFP 1998: Daily Summary of Operations
- ( Feb. 17-23,1998 )Feb. 17,1998 Day No. 48 Ship Location: Marmagoa Port, India
At Kaashidhoo, all measurements relating to aerosol radiation, chemistry as well as trace gas sampling have begun. NOAA-AVHRR cloud image over the Arabian Sea indicates ITCZ activity as far as10 N. FY-2 Chinese geostationary satellite cloud image are not available. Kaashidhoo area is also under scattered small cumuli. In the Arabian Sea and near Kaashidhoo the boundary layer flow, as indicated by the FSU model back-trajectory analyses, is northerly. Sagar Kanya Cruise # 133 is ready to depart from Goa, India.
Feb. 18,1998 Day No. 49 Ship Location: Marmagoa Port, India
FY-2 and NOAA-AVHRR data show clear sky conditions north of 10 N. There is some strengthening of ITCZ south of equator. Kaashidhoo is near the northern boundary of ITCZ cloudiness and cloud pictures taken from Kaashidhoo show scanty clouds. The boundary later flow in this region is northerly, as indicated by the FSU model analyses. Sagar Kanya leaves Goa.
Feb. 19,1998 Day No. 50 Ship Location: 13
o49’N, 71o34’ ESimilar meteorological situation persists. The ITCZ cloudiness now extends to the southern tip of India as seen from NOAA-AVHRR cloud images. FY-2 images are not available. Cloud pictures taken at 0900 UTC at Kaashidhoo indicate clear sky conditions. The boundary layer flow near Kaashidhoo is northerly. The FSU model analyses indicate development of convective activity east and north of Madagaskar. No satellite coverage of the area is available to confirm this.
Feb. 20,1998 Day No. 51 Ship Location: 11
o07’N, 71o38’ESagar Kanya has now cleared the EEZ of India and is on its way to Malé. NOAA-AVHRR image indicates long linear NW-SE or NE-SW oriented cloud features in the region between 10 N and equator. FY-2 images are not available. Kaashidhoo cloud pictures show scattered clouds. Boundary layer flow near Kaashidhoo is indicated to be from north. According to the FSU model analyses, the convective activity east of Madagaskar has now intensified.
Feb. 21,1998 Day No. 52 Ship Location: 09
o13’N, 73o21’ENOAA-AVHRR cloud image from a pass now centered on the Bay of Bengal, show similar ITCZ activity. There are low level stratiform clouds over the head Bay of Bengal. Kaashidhoo cloud pictures show scattered cumulus clouds. The boundary layer flow in the region is now changing from northerly to northeasterly. ITCZ convection off Madagaskar continues to be strong. No FY-2 images are available.
Feb. 22,1998 Day No. 53 Ship Location: 08
o15’N, 75o59’ESagar Kanya again enters the Indian EEZ for instrument intercomparison off Trivandrum. The NOAA-AVHRR pass has now shifted to the western Arabian Sea. ITCZ seems to be quite active in the belt between 10 S and 30 S. No FY-2 images are available. Near Kaashidhoo the sky is indicated to be clear. FSU analyses indicate new centers of convection near 70 E, 07 S. The convective activity east of Madagaskar shows further deepening.
Feb. 23,1998 Day No. 54 Ship Location: 08
o00’N, 74o00’ENOAA-AVHRR cloud image show distinct weakening of ITCZ activity north of equator. Low level clouds cover the northernmost regions of the Arabian Sea. Kaashidhoo remains in a region of clear sky. The boundary layer flow near Kaashidhoo is indicated to be close to easterly. FSU model analyses indicate continued development of convective activity near Madagaskar. ORV Sagar Kanya stops off Minicoy for MWR intercomparison.
INDOEX – FFP 1998: Daily Summary of Operations
- ( Feb. 24- Mar 02,1998 )Feb. 24,1998 Day No. 55 Ship Location: 04
o42’N, 73o45’ESagar Kanya has sails out of Indian EEZ towards Malé. NOAA-AVHRR cloud image shows that ITCZ activity is largely confined to south of Equator. A very E-W narrow band of low level cloudiness extends across the middle Arabian Sea. FY-2 data continue to be unavailable. At Kaashidhoo, the sky is clear and the boundary layer flow is indicated to be from the East. FSU model analyses indicate further deepening of the convective system off Madagaskar.
Feb. 25,1998 Day No. 56 Ship Location: Malé Port, Republic of Maldives
FY-2 images have become available. Both NOAA-AVHRR and FY-2 cloud images indicate some northward movement of ITCZ in the Arabian Sea sector. Kaashidhoo cloud pictures taken at 0730 show overcast sky. However, NOAA-AVHRR image taken 2 hrs 30 min later shows the region to be cloud free. The FSU analyses indicate boundary layer flow in this region to be from NE. The analyses also indicate fresh development of strong convection near 05 S between 70-80 E.
Feb. 26,1998 Day No. 57 Ship Location: Malé Port, Republic of Maldives
Conditions similar to the earlier day persisted. NOAA-AVHRR and FY-2 cloud images are available. Kaashidhoo cloud picture shows clear sky. FSU model results show boundary layer flow to be from the East.
Feb. 27,1998 Day No. 58 Ship Location: 04
o40’N, 73o37’EFY-2 and NOAA-AVHRR cloud images show clear weakening of the ITCZ activity south of equator. Northern regions of Arabian Sea are under cloudiness associated with a strong western disturbance over the Indian region. FSU analyses indicate strong region of convection centered at 60 E, 05 N. Cloud picture from Kaashidhoo shows scattered clouds.
Feb. 28,1998 Day No. 59 Ship Location: 04
o58’N, 73o24’EThe cloud images from FY-2 and NOAA-AVHRR show that, except for a narrow E-W band of cloudiness near 08N, most of the ITCZ was concentrated in the region south of equator. The entire region of Arabian Sea and the Bay of Bengal was cloud free. Both the cloud photograph from Kaashidhoo and the All-Sky camera photograph from the ship show clouds associated with this cloud band. The western disturbance over northern regions of Indian landmass has further intensified and moved southwards. Peninsular India is also under some scattered cloudiness. FSU model analyses show the boundary layer flow near Kaashidhoo to be northeasterly. Centers of convective activity are indicated at locations (70E, 10S), (90E, 07S) and (60-70E, 27S).
Mar. 01,1998 Day No. 60 Ship Location: 04
o33’N, 73o42’EFy-2 images were not available. Afternoon NOAA-AVHRR image shows strengthening of the ITCZ in the Indian sector and a slight northward intrusion of convective activity. Kaashidhoo and Shipbased photographs show mostly clear sky. Boundary layer flow is largely from NE. Model analysis also indicates strong convective activity near (70-90E, 00-10S) with precipitation values reaching as high as 60 mm/d. Another center of convection is indicated at (52E, 05S).
Mar. 02,1998 Day No. 61 Ship Location: 01
o14’N, 74o00’EThe northward excursion of ITCZ continued and the convective cloudiness extended almost to 10N. The model analyses indicate the boundary layer flow to be northerly at the Ship Location. ITCZ clouds were seen in the all-sky photograph taken from the ship. Entire Arabian Sea and southern Bay of Bengal remained free of clouds. The boundary layer flow is from NE.
INDOEX – FFP 1998: Daily Summary of Operations
- ( Mar. 03-09,1998 )Mar. 03,1998 Day No. 62 Ship Location: 01
o29’S, 72o48’EMajor convective activity region in the ITCZ moved eastwards. However, another cloud band oriented SW-NE brought clouds over the Ship Location and over Kaashidhoo site. Kaashidhoo cloud image showed overcast sky. Boundary layer flow over the region is from NE.
Mar. 04,1998 Day No. 63 Ship Location: 03
o31’S, 71o11’ECloud images from FY-2 and NOAA-AVHRR show southeastward movement of convective cloudiness associated with ITCZ. A new region of strong convective activity developed near (50-65E, 10S). The narrow cloudband near the equator too moved eastward bringing clear sky over Kaashidhoo and the Ship Location. The boundary layer flow continues to be from NE. Kaashidhoo and the Ship Location remained in largely cloud free region.
Mar. 05,1998 Day No. 64 Ship Location: 05
o51’S, 69o20’EFY-2 data are not available. The NOAA-AVHRR afternoon pass over the Arabian Sea indicates two regions of strong convective activity near (62E,12S) and (72E,09S). Both these regions intensified over the last 24 hours and model analyses associate a precipitation intensity reaching ~50 mm/d. The boundary layer flow is from NE. Both the shipbased camera and cloud images from Kaashidhoo indicate patchy clouds.
Mar. 06,1998 Day No. 65 Ship Location: 07
o57’S, 67o32’EFY-2 and NOAA-AVHRR cloud images show some weakening of the ITCZ activity in the Indian region. The ship and Kaashidhoo are under the outer periphery of weak convective regions near the northern boundary of the ITCZ. At the Ship Location the boundary layer flow is predominantly from N.
Mar. 07, 1998 Day No. 66 Ship Location: 09
o25’S, 66o21’EThe satellite images show further weakening of ITCZ in the Indian Ocean Sector and there are no areas of strong convection. Both the Arabian Sea and the Bay of Bengal are cloud free. Sagar Kanya is located in the area of patchy clouds associated with extratropical cloud band. Cloud images and photographs from Kaashidhoo show marginal cloud cover. The model analyses indicate boundary layer flow from N or NW.
Mar. 08, 1998 Day No. 67 Ship Location: 11
o01’S, 64o58’EThe cloudiness associated with the extratropical band has moved eastwards and the Sagar Kanya is now located near its edge. No new regions of strong convection are developing. Kaashidhoo is now under clear sky. At the Ship Location near 10 S, the boundary layer flow is indicated to be from NW.
Mar. 09, 1998 Day No. 68 Ship Location: 13
o02’S, 63o25’EThe FY-2 and NOAA-AVHRR images show further eastward movement of the cloudiness associated with the extratropical band. New convective cloud region is seen to develop near 88E, 15S. Sagar Kanya and Kaashidhoo are in a region of small scattered cumuli in a largely cloud free area. Boundary layer flow near the Ship Location is indicated to be from the west. However, near Kaashidhoo, the flow is mainly from the NNE.
INDOEX – FFP 1998: Daily Summary of Operations
- ( Mar. 10-16,1998 )Mar. 10, 1998 Day No. 69 Ship Location: 15
o04’S, 61o51’EThe convective activity is now more organized with the center located near 84E, 12S. There is hardly any cloudiness associated with ITCZ north of equator and Kaashidhoo site is free of clouds. The Sagar Kanya is located near the boundary of ITCZ and is under patchy clouds. Most of the oceanic areas north of equator in the INDOEX region of interest remain cloud free, except for a thin EW oriented cloud band in the Bay of Bengal. The FSU back-trajectory analyses indicate the boundary layer flow to be westerly.
Mar. 11, 1998 Day No. 70 Ship Location: 17
o52’S, 59o44’EThe mesoscale convective system located at 83E, 14S has further intensified and is seen as a compact cyclonic circulation in NOAA-AVHRR and FY-2 cloud images. The ITCZ activity is mostly confined to southern hemisphere. Sagar Kanya is in the ITCZ and the boundary layer flow has changed from westerly to easterly at this location. All-Sky Camera images from Sagar Kanya show small patches of convective clouds. Kaashidhoo remains in a cloud free area.
Mar.12, 1998 Day No. 71 Ship Location: Port Louis, Mauritius
The FY-2 cloud image shows some weakening of the convective system. Most of the ITCZ activity is confined to south of equator. The Sagar Kanya has now entered the EEZ of Mauritius and data are not available. Kaashidhoo continues to be in a clod free region. The FSU analyses indicate the boundary layer flow to be easterly or south-easterly.
Mar. 13, 1998 Day No. 72 Ship Location: Port Louis, Mauritius
The FY-2 and NOAA-AVHRR images indicate some northward movement of ITCZ in the Bay of Bengal region. The remnant of the convective activity associated with the extratropical band is now located near 65E, 10S in an area northwest of Sagar Kanya. Sagar Kanya continues to be in the EEZ of Mauritius and no data is available. No cloud photographs are available from Kaashidhoo.
Mar. 14, 1998 Day No. 73 Ship Location: Port Louis, Mauritius
ITCZ in the Indian Ocean region has become more active and the convective cloudiness has advanced northwards in the 80-100E sector. A cloudband has formed in the Bay of Bengal. Arabian Sea has remained mostly cloud free. Sagar Kanya is in the Mauritius EEZ and no data are available. The boundary layer flow near the Réunion Is from the east. No cloud pictures are available from Kaashidhoo.
Mar. 15, 1998 Day No. 74 Ship Location: Port Louis, Mauritius
ITCZ remains active and the Bay of Bengal cloudband has weakened. Sagar Kanya is in the Mauritian EEZ and no data are available from ship. Kaashidhoo cloud image shows clear sky. Boundary layer flow is NNE at Kaashidhoo and SSE at Réunion.
Mar. 16, 1998 Day No. 75 Ship Location: 18
o26’S, 59o15’EAs seen in the cloud images from FY-2 and NOAA-AVHRR, most of the ITZ activity is confined to southern hemisphere between 05 S and 25 S. There were two convective systems at 62 E, 07 S and 80 E, 25 S. The Arabian Sea and the bay of Bengal were largely free of convective cloudiness. Low clouds were present over the southern portion of the Arabian Sea. FY-2 and NOAA-AVHRR images indicate development of cirrus cloud plumes over the Indian landmass. The Indian landmass is covered by the NE-SW oriented cirrus outflow. Sagar Kanya is within the ITCZ close to the convective activity associated with tropical storm Fiona. The all-sky camera cloud picture shows almost overcast sky. Kaashidhoo is cloud free. The flow at Kaashidhoo is from NE and at the Ship Location it is from SE.
INDOEX – FFP 1998: Daily Summary of Operations
- ( Mar. 17-23,1998 )Mar. 17, 1998 Day No. 76 Ship Location: 16
o02’s, 60o59’EITCZ activity in the Indian region is scattered. The cirrus band over the Indian landmass has intensified and moved eastward, covering part of Bay of Bengal. There are large cold air intrusions over northern India from N and NW. Off Mauritius, some convective activity has developed. The storm Fiona weakened somewhat. The all-sky camera picture from the ship shows clouds over the region. Region of Kaashidhoo is free of convective cloudiness.
Mar. 18, 1998 Day No. 77 Ship Location: 13
o30’S, 62o16’EThe convective activity east of Mauritius has organized into a cyclonic system. The cirrus flow band has moved further east over the Bay of Bengal. A large western disturbance has entered over northwest India. The southern Arabian Sea and the Kaashidhoo site is cloud free however. All-sky camera picture from the ship shows cumulus clouds. The boundary layer flow regime at the location of Sagar Kanya is under the influence of the convective activity associated with tropical storm Fiona.
Mar. 19, 1998 Day No. 78 Ship Location: 10
o55’S, 63o33’EITCZ shows some northward advance. There are a large number of mesoscale centers of convection in the ITCZ in the Indian region. FY-2 image shows that the tropical storm Fiona has moved west and further weakened and lay centered at 50 E, 05 S. The large cirrus flow band now extends from equator to beyond 40 N across the Bay of Bengal. Arabian Sea was mainly cloud free. Scattered cumulus and cirrus clouds were observed at the Ship Location. Kaashidhoo cloud image shows patches of cumulus and cirrus clouds. The boundary layer flow near the Ship Location is from north. At Kaashidhoo the flow is from NE.
Mar. 20, 1998 Day No. 79 Ship Location: 08
o26’S, 64o48’EFY-2 and NOAA-AVHRR cloud images show that the convective activity located at 60 E, 07 S intensified and produced strong rainfall. The Sagar Kanya is now under the ITCZ cloudiness and the observations indicate the presence of clouds at multiple levels including cirrus. The cirrus outflow band has streched further. Kaashidhoo still remains in a predominantly cloud free area.
Mar. 21, 1998 Day No. 80 Ship Location: 05
o48’S, 66o07’EFY-2 data is corrupted with large amount of dropouts in the tropical region of interest. The NOAA-AVHRR cloud image clearly shows a further northward movement of ITCZ. The Sagar Kanya is under convective region and observations indicate raining cumulo-nimbus clouds alongwith broken high clouds. The all-sky camera picture shows overcast sky. Kaashidhoo cloud photograph shows clear sky. The FSU model analyses indicate the flow at Kaashidhoo to be clearly from the NE.
Mar. 22, 1998 Day No. 81 Ship Location: 03
o04’S, 67o30’EITCZ has shown further advance over the Arabian Sea and low convective clouds now reached as far as 10 N. The cirrus cloud band has moved further east. Sagar Kanya again experienced raining cumulo-nimbus clouds within the ITCZ. Kaashidhoo is also near the northern boundary of ITCZ. The all-sky cloud image from the ship shows overcast sky. No cloud pictures are available from Kaashidhoo. FY-2 images show a nearly cloud free Arabian Sea and Bay of Bengal. The Model analyses indicate the boundary layer flow at Kaashidhoo is from N.
Mar. 23, 1998 Day No. 82 Ship Location: 00
o17’S, 68o51’EThe NOAA-AVHRR and FY-2 images show weakening of the ITCZ in the northern portions. FY-2 images continue to be affected by dropouts. There is strong thunderstorm activity over the East Coast of India. Arabian Sea is mostly cloud free. The Sagar Kanya is now located just outside the ITCZ convective regions and observations indicate small amount of cloudiness. No cloud pictures are available from Kaashidhoo. The boundary layer flow is predominantly northerly.
INDOEX – FFP 1998: Daily Summary of Operations
- ( Mar. 24-30,1998 )Mar. 24, 1998 Day No. 83 Ship Location: 02
o29’N, 69o00’EThere is further weakening of ITCZ activity in the Arabian Sea sector. Sagar Kanya is located in a region of sparse cumulus. The boundary layer flow has again turned northeasterly. No cloud pictures are available from all-sky camera and from Kaashidhoo. However, the satellite images show the Arabian Sea and the Bay of Bengal to be cloud free.
Mar. 25, 1998 Day No. 84 Ship Location: 05
o19’N, 69o00’EITCZ shows very weak convective activity over the equator in the Arabian Sea sector. Sagar Kanya has just moved out of the ITCZ and the observations indicate largely clear skies. The entire Arabian Sea remains a cloud free area. The thunderstorm activity near the north Bay of Bengal has intensified. The flow over the region of Sagar Kanya and Kaashidhoo is northeasterly.
Mar. 26, 1998 Day No. 85 Ship Location: 08
o30’N, 69o00’ESagar Kanya is at the northern boundary of ITCZ and experienced sparse cumuli. Conditions were similar at Kaashidhoo. The FSU model analyses indicate the flow to be northerly.
Mar. 27, 1998 Day No. 86 Ship Location: 11
o22’N, 68o15’ESituation similar to Mar. 26th persisted. During later part of the day, sky was cloud free at the location of the ship. The boundary layer flow was indicated to be from the north.
Mar. 28, 1998 Day No. 87 Ship Location: 14
o15’N, 68o33’EFY-2 and NOAA-AVHRR images clearly show further northward movement of ITCZ. The convective clouds associated with ITCZ have reached the southern tip of India. Kaashidhoo is also under ITCZ. At the Sagar Kanya location, the sky is cloud free, as shown by the all-sky cloud image. The boundary layer flow at the Ship Location is indicated to be from NNW.
Mar. 29, 1998 Day No. 88 Ship Location: 15
o25’N, 71o23’EITCZ shows continued activity over Kaashidhoo site. Fy-2 and NOAA-AVHRR cloud images show a marked development of a low-pressure system over the head Bay of Bengal. No cloud images are available from the ship. Kaashidhoo cloud picture indicates scanty cloud cover. The flow at Kaashidhoo site is from NE.
Mar. 30, 1998 Day No. 89 Ship Location: Marmugoa Port, India
Cloud images from FY-2 and NOAA-AVHRR show further advance of ITCZ in the Arabian Sea sector. Regions of strong convective cloudiness have developed just south of the equator in the 60-80 E longitude. The Sagar Kanya has now entered the Indian EEZ and no data from the ship are available. No cloud pictures are available from Kaashidhoo also. At Kaashidhoo the FSU analyses indicate the boundary layer flow to be from NE.
Appendix A: ORV Sagar Kanya Ship Location
Appendix B: ORV Sagar Kanya Specifications
Name: ORVSagar Kanya (India)US NODC Code: 41SG, Classification Society: LLOYD'S REGISTER OF SHIP
Design: RF Reedereigemeinschaft, Draft: Forchungsschiffahrt GmbH, Bremen
Construction: Schlichting-Werft, Travemünde
Contact:Director, Antarctic Study Centre, Dept. of Ocean Development (DOD), Govt. of India
Vasco-daGama, Goa, 403 802, INDIA, Tel: 91-0834-512317 Fax: 91-0834-511443
Main vessel activity: Oceanography Year built: 1983
Ocean area where vessel operates: Indian Ocean
| Displacement: 4200 tons | Crew: 60 | Launched: 1983 |
| Scientists: 31 | Max. Speed: 14.5 knots | Range: 8700 n mi |
| Length (m): 100.34 | Range (n. mi.): 9999 | Crew: 42 |
| Beam (m): 16.39 | Endurance (days): 45 | Officers: 18 |
| Draft (m): 5.60 | Cruise speed (kt): 12.0 | Scientists: 31 |
| Gross Tons: 4209 | Max. speed (kt): 14.2 | Air Conditioned: yes |
| Power (HP): 4825 | Aux. Power (HP): |
| Dry cargo holds: 450 m3 | Wet laboratories (total area): 80 m2 |
| Dry laboratories (total area): 290 m2 | Fresh water generator capacity: 40 m3 |
| Freeboard to working deck: 9.8 m | Free working deck area: 470 m2 |
| Space for container laboratory: 2 m x 6 m |
Design Particulars :
Hull material: Steel		Energy sources: none	Main engine(s): 5
Make: Diesel El Model		Power (BHP) each main engine: 4825 at 750 rpm
Propeller Diameter: 2.750 m	Max propeller rpm: 220
Total power auxiliary diesels: 0HP

Electrical systems:
AC Voltage: 660/400 V	total 630 kVA	3 phase 50 Hz
AC Voltage: 0/400 V	total 400 kVA	3 phase50 Hz
DC Voltage: 0V		total 0V
Stabilized system for scientific equipment: 230 VAC	160 AMP 	50 Hz
Fixed equipment (navigation and communication):
Nav. equip: Radar Decca SatNav Gyro EMLog DopLog
Comms: Fax SatCom	Comm sat: none 	GPS: none
Acoustic Echosounders for scientific research:	12 kHz	30 kHz
Sonar:Geological

Provisions for silent ship operation:
Steel wire length: 9999 m		Safe working load 	2 tons
Conducting cable length:6000 m		Safe working load	2 tons
Trawl winch length: 9999 m		Safe working load	18 tons
Other: PVC Coated Wirelength:6000 m	Safe working load	2 tons
Gantry Position: Stern, Amidships	Clearance above deck: 9m
Outboard extension: 3 m			Safe working load at max. reach: 22 tons
Crane Position: stern, Amidships	Clearance above deck: 12 m
Outboard extension: 9 m			Safe working load at max. reach: 22 tons
Other winches for instruments or sampling: Side Scan Sonar	Magneto-meter	Under Water
Electronic data processing equipment permanently available on board:
Computer: HP 1000 2117F: IBM PC/AT
Appendix C: Kaashidhoo Climate Observatory
One of the highlights of the INDOEX FFP was the establishment of the Kaashidhoo Climate Observatory (KCO). Located on Kaashidhoo Island in the Republic of Maldives at 73.466° E, 4.965 °N, the site is ideal for measurements of both pristine air from the southern Indian Ocean and continental air flowing from the Indian subcontinent. It also provides a unique situation to study the role of aerosols in modifying cloud properties (the indirect radiative forcing term due to aerosols). After a year-long planning and construction phase, the measurements at KCO began on 11 February 1998. Most of the instruments are mounted on top of a 13.5 m tall tower, including the sampling intakes for aerosol and trace gas measurements; aerosol and gas analyzers are located inside the observatory building. The observatory is equipped with all necessary computers and peripherals including a teleTel and network connection. The observatory was formally inaugurated by the President of the Republic of Maldives on Feb. 24, 1998. The entire project at Kaashidhoo was undertaken in collaboration with the Govt. of the Republic of Maldives, the Ministry of Planning, Human Resources and Environment (MPHRE). The observatory provided excellent measurement support during the FFP and most measurements are continued on a long-term basis. Besides the present suite of measurements, additional instruments will be added before the 1999 IFP (January -April 1999). More information about KCO is available at http://www-indoex.ucsd.edu/observatory/.
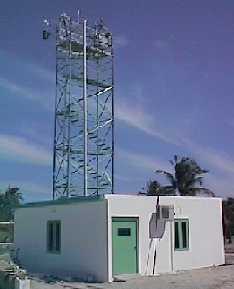 KCO facilities |
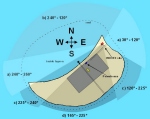 KCO data sectors: a)clear zones; b) and c) zones under effects of nearby islands, and d) exclusion zone due to local pollution. |
INDOEX Kaashidhoo Climate Observatory - Top View of Building
INDOEX Kaashidhoo Climate Observatory - Top View of Tower
Appendix D: List of Participants in INDOEX First Field Phase 1998
ACHARYA, Y.B. Physical Research Laboratory P.O. Box No. 4218 Navrangpura, Ahmedabad 380 009 INDIA email: yacharya@prl.ernet.in BABU, M.T. National Institute of Oceanography H.O. Dona Paula Goa 403 044 INDIA email: mtbabu@csnio.ren.nic.in BAHULAYAN, N. National Institute of Oceanography H.O. Dona Paula Goa 403 044 INDIA Fax: 91 832 223 340 email: babu@csnio.ren.nic.in BHATT, G.S. Centre for Atmospheric & Oceanic Sciences Indian Institute of Science Banglore 560 012 INDIA Tel: 091-080-3340450 Fax: 091-080-3341683 email: bhat@cas.iisc.ernet.in BHATIA, R.C. Indian Meteorological Department Lodi Road, New Delhi 110 003 INDIA BLAKE, DONALD R. Department of Chemistry University of California, Irvine Irvine, CA 92697 USA Tel: (949) 824-4195 email: dblake@orion.oac.uci.edu CACHIER, HELEN Laboratoire des Sciences du Climat et de lEnvironnement/CFR Laboratoire Mixte CEA-CNRS Domaine du CNRS, Bat 12 Ave de la Terrasse 91 198-Gif sur Yvette Cedex FRANCE Tel (33) 1 69 82 35 48 Fax (33) 1 69 82 35 68 email:Helene.Cachier@lsce.cnrs-gif.fr CANTRELL, WILL Geophysical Institute 903 North Koyukuk Drive University of Alaska Fairbanks, Alaska 99775-7320 USA Tel: (907) 474-5606 Fax: (907) 474-7290 email: ftwhc@aurora.alaska.edu CONANT, WILLIAM Center for Atmospheric Sciences Scripps Institution of Oceanography, UCSD 9500 Gilman Drive #0221 La Jolla, CA 92093 USA Tel: 619-534-1119 Fax: 619-534-7452 email: wconant@ucsd.edu DESA, EHRLICH National Institute of Oceanography H.O. Dona Paula Goa 403 044 INDIA DICKERSON, RUSSELL R. Department of Meteorology The University of Maryland College Park, MD 20742 USA Tel: (301) 405-5364 Fax: (301) 314-9482; zd Email: russ@atmos.umd.edu DODDRIDGE, BRUCE G. Department of Meteorology University of Maryland College Park, MD 20742 USA Tel: 301-405-7628 Fax: 301-314-9482 (FAX) email: bruce@atmos.umd.edu GEORGE, M.D. National Institute of Oceanography H.O. Dona Paula Goa 403 044 INDIA Tel: 091-0832-226253 56 Fax: 091-0832-221340 email: george@csnio.ren.nic.in GRANAT, LENNART Department of Meteorology Stockholm University 10691 Stockholm, SWEDEN Tel: 46-8-164348 Fax: 46-8-159295 email: lennart@misu.su.se GUPTA, PRABHAT National Physical Laboratory Dr. K.S. Krishnan Marg New Delhi 110 012 INDIA Tel: 091-011-5787162 Fax: 091-011-5752678, 5764189 HEYMSFIELD, ANDREW Mesoscale and Microscale Meteorology (MMM) National Center for Atmospheric Research (NCAR) 3450 Mitchell Lane Boulder, Colorado 80302 USA Tel: (303) 497-8943 Fax: (303) 497-8171 Email: heyms1@ncar.ucar.edu HOLBEN, BRENT NASA - Goddard Space Flight Center Code 923 Greenbelt, MD 20771 USA Tel: 301 286 2975 Fax: (301) 286-1757 email: brent@spamer.gsfc.nasa.gov IZAGUIRRE, MIGUEL ANGEL University of Miami Rosenstiel School of Marine and Atmospheric Science 4600 Rickenbacker Causeway Key Biscayne FL 33149 USA Tel: 305-361-4695 Fax: 305-361-4891 (4126) email: mizaguirre@rsmas.miami.edu JAYARAMAN, A. Planetary Atmospheric Sciences Division Physical Research Laboratory P.O. Box No. 4218 Navrangpura, Ahmedabad 380 009 INDIA Tel: 091-79-462 129 Fax: 091-79-656 0502 email jraman@prl.ernet.in JAYAKUMAR, AMAL National Institute of Oceanography H.O. Dona Paula Goa 403 044 INDIA Tel: 091-0832-226253 56 Fax: 091-0832-221340 email: amal@csnio.ren.nic.in JHA, BHASKAR 411 Love Building, MC 4520 Department of Meteorology Florida State University Tallahassee, FL 32306 USA Tel: (850) 644-2732 Fax: (850) 644-9642 email: bhaskar@citm1.met.fsu.edu KAMRA, A.K. Indian Institute of Tropical Meteorology Dr. Homi Bhabha Road Pune 411 008 INDIA KLEY, DIETER Institut fuer Chemie der Belasteten Atmosphaere Department fuer Chemie und Dynamik der Geosphaere Forschungszentrum Juelich D-52425 Juelich GERMANY Tel: 49 2461 61 37 40 Fax: 49 2461 61 53 46 email: d.kley@fz-juelich.de KRISHNAMOORTHY, K. Space Physics Laboratory Vikram Sarabhai Space Centre Trivandrum 695-002 INDIA Tel: 091-0471-462404, 463105 Fax: 091-0471-461313 KRISHNAMURTI, T.N. 423 Love Building, MC 4520 Department of Meteorology Florida State University Tallahassee, FL 32306 USA Tel: (850) 644-2210 Fax: (850) 644-9642 email: tnk@met.fsu.edu KULSHRESTHA, UMESHA National Physical Laboratory Dr. K.S. Krishnan Marg New Delhi 110 012 INDIA Tel: 091-011-5787162 Fax: 091-011-5752678, 5764189 LAL, SHYAM Physical Research Laboartory Navarangpura Ahmedabad 380 009 INDIA Tel: 091-79-462129 Fax: 091-79-6560502 email: shyam@prl.ernet.in LEE, CHARLES Chemistry and Biochemistry Dept. University of California, San Diego La Jolla, CA 92093-0356 USA Tel: (619) 534-6053 Fax: (619) 822-0389 email: c7lee@chem@ucsd.edu LUBIN, DAN Center for Clouds, Chemistry and Climate Scripps Institution of Oceanography, UCSD 9500 Gilman Drive #0221 La Jolla, CA 92093 USA Tel: 619-534-6369 Fax: 619-534-7452 email: dlubin@ucsd.edu MANGHANANI, VIJAY KUMAR Department of Marine, Earth, and Atmospheric Sciences College of Physical and Mathematical Sciences Box 8208 North Carolina State University Raleigh, NC 27695-8208 USA MANDAL, TUHIN National Physical Laboratory, New Delhi Dr. K.S. Krishnan Marg New Delhi 110 012 INDIA MARING, HAL Marine and Atmospheric Chemistry University of Miami 4600 Rickenbacker Causeway Key Biscayne FL 33149 USA Tel: (305) 361-4679 Fax: (305) 361-4891 email: hmaring@rsmas.miami.edu MEYWERK, JENS Center for Clouds, Chemistry & Climate Scripps Institution of Oceanography, UCSD 9500 Gilman Drive #0239 La Jolla, CA 92093 USA Tel: 619-822-2592 Fax: 619-534-4922 email: jens@fiji.ucsd.edu MINISTRY OF PLANNING, HUMANRESOURCES AND ENVIRONMENT Ghaazee Building Malé 20-05 Republic of Maldives MITRA, A.P. National Physical Laboratory Dr. K.S. Krishnan Marg New Delhi 110 012 INDIA Tel: 91-011-5745298 Fax: 91-011-5752678, 5764189 email: apmitra@doe.ernet.in |
MURUGAVEL, P. Indian Institute of Tropical Meteorology Dr. Homi Bhabha Road Pune 411 008 INDIA NAJA, MANISH Physical Research Laboratory P.O. Box No. 4218 Navrangpura, Ahmedabad 380 009 INDIA NAQVI, S.W.A. National Institute of Oceanography H.O. Dona Paula Goa 403 044 INDIA Tel: 091-832-221322, 226253 Fax: 091-832-223340 email: naqvi@csnio.ren.nic.in NEWCOMB, WAYNE NASA - Goddard Space Flight Center Code 923 Greenbelt, MD 20771 - USA Fax: (301) 286-1757 email: wayne@spamer.gsfc.nasa.gov NGUYEN, HUNG V. Center for Clouds, Chemistry and Climate Scripps Institution of Oceanography, UCSD 8603 La Jolla Shores Drive, DSDP Building A, #21 La Jolla, CA 92037-0239 USA Tel: 619-534-1040 Fax: 619-534-4922 email: hnguyen@ucsd.edu PANDEY, P.C. Antarctic Study Centre, Vasco-da-Gama Goa 403 802 INDIA Tel : 091-0834-512317 Fax : 091-0834-511443 PARAMESHWARA, VINAYAK Department of Marine, Earth, and Atmospheric Sciences College of Physical and Mathematical Sciences Box 8208 North Carolina State University Raleigh, NC 27695-8208 USA PARASHAR, D.C. National Physical Laboratory Dr. K.S. Krishnan Marg New Delhi 110012 INDIA Tel: 091-11-5787162 Fax: 091-11-5752678, 5764189 POLAILLON, NICOLAS National Center for Atmospheric Research and LEcole Polytechnique c/o Dr. Andrew Heymsfield Mesoscale and Microscale Meteorology (MMM) National Center for Atmospheric Research (NCAR) 3450 Mitchell Lane Boulder, Colorado 80302 USA PRABHU, A. Indian Institute of Science Banglore 560 012 INDIA PROSPERO, JOSEPH M. Cooperative Inst. Marine & Atmospheric Studies (CIMAS) Rosenstiel School of Marine and Atmospheric Science University of Miami 4600 Rickenbacker Causeway Miami, Florida 33149 USA Tel: 305-361-4789 Fax: 305-361-4891 email: jprosper@rsmas.miami.edu RAJU, J.V.S. Indian Institute of Science Banglore 560 012 INDIA RAMAN, SETHU Department of Marine, Earth, and Atmospheric Sciences College of Physical and Mathematical Sciences Box 8208 North Carolina State University Raleigh, NC 27695-8208 USA Tel: (919) 515-1440 Fax: (919) 515-7802 email: sethu_raman@ncsu.edu RAMANA, V. Space Physics Laboratory Vikram Sarabhai Space Centre Trivandrum 695-002 INDIA RAMANATHAN, V. Center for Atmospheric Sciences Center for Clouds, Chemistry and Climate Scripps Institution of Oceanography, UCSD 8605 La Jolla Shores Dr., Rm. 330 La Jolla, CA 92037 Tel: (619) 534-8815 Fax: (619) 534-7452 email: vramanathan@ucsd.edu RAMESH BABU, V. National Institute of Oceanography H.O. Dona Paula, Goa 403 044 INDIA Tel: 91 832 226 253 - 56 Fax: 91 832 223 340 email: rbabu@csnio.ren.nic.in RAO, L.V.G. Institute of Oceanography H.O. Dona Paula, Goa 403 044 INDIA Tel: 091-0832-226253 56 Fax: 91 832-221 340 email: lvgrao@csnio.ren.nic.in ROWLAND, F. SHERWOOD Department of Chemistry University of California Irvine, California, 92697-2025 Tel: (949) 824-6016 email: rowland@uci.edu RUSSEL, D.G. Indian Meteorological Department Lodi Road, New Delhi 110 003 INDIA SAHA, A. Space Physics Laboratory Vikram Sarabhai Space Centre Trivandrum 695-002 INDIA SATHEESH, S.K. Center for Clouds, Chemistry and Climate Scripps Institution of Oceanography, UCSD 9500 Gilman Drive #0221 La Jolla, CA 92093 USA Tel: 619-822-1356 Fax: 619-534-4922 email: satheesh@fiji.ucsd.edu SAVOIE, DENNIS L. Rosenstiel School of Marine and Atmospheric Science Marine and Atmospheric Chemistry University of Miami 00 Rickenbacker Causeway FL 33149 USA Tel: (305) 361-4712 email: dsavoie@rsmas.miami.edu SEN GUPTA, K. Space Physical Laboratory Vikram Sarabhai Space Centre Trivandrum 695 002 INDIA Tel: 091-0471-462404, 463105 Fax: 091-0471-461313 SHARDA CSIR Centre for Mathematical Modeling & Computer Simulation (C-MMACS) NAL Belur Campus, Banglore 560037 INDIA Tel: 091-080-5274667, 5274649 Fax: 091-080-5260392 SHAIKKOYA, K. Indian Meteorological Department Lodi Road, New Delhi 110 003 INDIA SHARMA, M.S.S. National Institute of Oceanography H.O. Dona Paula, Goa 403 044 INDIA SHARMA, R.N. National Physical Laboratory Dr. K.S. Krishnan Marg New Delhi 110 012 INDIA Tel: 091-011-5787162 Fax: 091-011-5752678, 5764189 SHAW, GLENN Geophysical Institute, 903 North Koyukuk Drive University of Alaska Fairbanks, Alaska 99775-7320 USA Tel: (907) 474-7625 Fax: (907) 474-7290 email: shaw@gi.alaska.edu SHENOY, D.M. National Institute of Oceanography H.O. Dona Paula, Goa 403 044 INDIA SIKKA, D.R. 40 Mausam Vihar, New Delhi 110051 INDIA SRIVASTAVA, S.K. Indian Meteorological Department New Delhi 110 003 INDIA SWATHI, P.S. CSIR Centre for Mathematical Modeling & Computer Simulation (C-MMACS) Bangalore 560 037 INDIA Tel: 091-080-5274667, 5274649 Fax: 091-080-5260392 email: swathi@cmmacs.ernet.in TANS, PIETER I. NOAA/CMDL 325 Broadway, R/E/CG1 Boulder, CO 80303 USA Tel: (303) 497-6678 Fax: (303)497-6290 email: ptans@cmdl.noaa.gov THIEMENS, MARK H. Department of Chemistry & Biochemistry University of California San Diego La Jolla, CA 92093-0356 USA Tel: (619) 534-5489 Fax: (619) 822-0389 email: mthiemens@ucsd.edu TIWARI, M.K. National Physical Laboratory Dr. K.S. Krishnan Marg New Delhi 110012 INDIA Tel: 091-11-5760078 Fax: 091-11-5752678, 5764189 email: mktiwari@csnpl.ren.nic.in TIWARI, V.S. Indian Meteorological Department Lodi Road New Delhi 110 003 INDIA VERNEKAR, K.G. Indian Institute of Tropical Meteorology Dr. Homi Bhabha Road Pune 411 008 INDIA Tel: 091-0212-330846 Fax: 091-0212-347825 WILLIAMS, STEVEN F. UCAR/Joint Office for Science Support (JOSS) P.O. Box 3000 Boulder, Colorado 80307 USA Tel: 303-497-8164 Fax: 303-497-8158 email: steve@joss.ucar.edu ZALPURI, K.S. National Physical Laboratory Dr. K.S. Krishnan Marg New Delhi 110 012 INDIA Tel: 091-011-5788220 Fax: 091-011-5752678, 5764189 email: zalpuri@npl@sirnetd.ernet.in zalpuri@csnpl.rev.nic.in |
Prof. Meinrat O. Andreae, Max-Planck Institut für Chemie, Mainz, Germany
Email: moa@diane.mpch-mainz.mpg.de
Prof. James A. Coakley, Oregon State University, Corvallis, Oregon
Email: coakley@ats.orst.edu
Prof. Dr. Paul J. Crutzen, Co-Chief Scientist, Max-Planck Institut für Chemie, Mainz, Germany
Email: air@mpch-mainz.mpg.de
Dr. Michel Desbois, Laboratoire de Météorologie Dynamique, Paris, France
Email: desbois@lmdx04.polytechnique.fr
Dr. Richard Dirks, University Corporation for Atmospheric Research, Boulder, Colorado
Email: dirks2@ncar.ucar.edu
Prof. Dr. Jost Heintzenberg, Institute of Tropospheric Research, Leipzig, Germany
Email: jost@tropos.de
Dr. Jeffrey T. Kiehl, National Center for Atmospheric Research, Boulder, Colorado
Email: jtkon@ncar.ucar.edu
Prof. Dieter Kley, Forschungszentrum, Jülich, Germany
Email: D.Kley@fz-juelich.de
Dr. Joach P. Kuettner, National Center for Atmospheric Research, Boulder, Colorado
Email: kuettner@ncar.ucar.edu
Prof. Jos Lelieveld, Rijiksuniversiteit Utrecht, The Netherlands
Email: lelieveld@fys.ruu.nl
Dr. A. P. Mitra, National Physical Laboratory, New Delhi, India
Email: apmitra@doe.ernet.in
Prof. Joseph M. Prospero, University of Miami, Miami, Florida
Email: jprospero@rsmas.miami.edu
Prof. V. Ramanathan, Co-Chief Scientist, Scripps Institution of Oceanography, La Jolla, California
Email: ram@fiji.ucsd.edu
Prof. Robert A. P. Sadourny, Laboratoire de Météorologie Dynamique, Paris, France
Email: sadourny@lmd.ens.fr
Dr. Adrian Tuck, National Oceanic and Atmospheric Administration, Boulder, Colorado
Email: Adrian.F.Tuck@noaa.gov
Dr. Francisco P. J. Valero, Scripps Institution of Oceanography, La Jolla, California
Email: fvalero@ucsd.edu
Hung V. Nguyen, Executive Secretary, Scripps Institution of Oceanography
La Jolla, California, Email: hnguyen@ucsd.edu
Appendix F: List of Acronyms
AVHRR Advanced Very High Resolution RadiometerC4 Center for Clouds, Chemistry, and Climate (UCSD)
CARPOS Cloud Aerosol Radiation Pollution Observing System
CERES Clouds and the Earth's Radiant Energy System (TRMM)
CIDS C4 Integrated Data System
CIMEL French radiometer
CLASS Crosschain Loran Atmospheric Sounding System
CNES Centre National d'Etudes Spatiales (France)
DMSP Defense Meteorological Satellite Program (U.S.)
DOD Department of Ocean Development (India)
ECMWF European Center for Medium-range Weather Forecasting
FFP First Field Phase (INDOEX)
FSU Florida State University
FY-2 Feng Yang (Chinese Geostationary Meteorological Satellite)
GMS Geostationary Meteorological Satellite of Japan
GSFC Goddard Space Flight Center (NASA)
IFP Intensive Field Phase (INDOEX)
IITM Indian Institute of Tropical Meteorology (India)
IISc Indian Institute of Science (India)
IITD Indian Institute of Technology, Delhi (India)
IMD Indian Meteorological Department (India)
INDOEX Indian Ocean Experiment
INSAT – Indian Geostationary- Meteorological satellite system – Location 74,84,94E
ISRO Indian Space Research Organization (India)
IRS-P3 Indian Remote Sensing Satellite – P3
ITCZ Inter-Tropical Convergence Zone
JOSS Joint Office for Science Support (UCAR)
LMD Laboratorie de Meteorologie Dynamique (France)
LOA Laboratoire d’Optique Atmosphérique (France)
LSCE Laboratoire des Sciences du Climat et de l’Environnement (France)
MBL Marine Boundary Layer
MISU Department of Meteorology, Stockholm University
MOS Modular Optoelectronic Scanner
NASA National Aeronautics and Space Administration (U.S.)
NCAR National Center for Atmospheric Research
NCSU North Carolina State University
NIO National Institute of Oceanography (India)
NOAA National Oceanic and Atmospheric Administration (U.S.)
NPL National Physical Laboratory (India)
NRL Naval Research Laboratory (U.S.)
OLR Outgoing Longwave Radiation
ORV Oceanographic Research Vessel
OSU Oregon State University
PBL Planetary Boundary Layer
PRL Physical Research Laboratory (India)
SABL Scanning Aerosol Backscatter Lidar
SAC Space Applications Centre, Ahmedabad (India)
ScaRaB Scanning for earth Radiation Budget
SIO Scripps Institute of Oceanography
SK Sagar Kanya
SPL Space Physics Laboratory (India)
SSC Scientific Steering Committee
SSM/I Special Sensor Microwave Imager
SSM/I /T2– Special Sensor Microwave Imager – Temperature Profiler
SST Sea Surface Temperature
SVISSR Super-duper Visible and Infrared Spin Scan Radiometer
TAF Terminal Area Forecast
TMI/PR TRMM Microwave Imager/Precipitation Radar (TRMM)
TOA Top of Atmosphere
TRMM Tropical Rainfall Measuring Mission
UCAR University Corporation for Atmospheric Research
UCI University of California at Irvine
UCSD University of California at San Diego
UM University of Mauritius
UMD University of Maryland
UV Ultra Violet
VHRR- Very High Resolution Radiometer
VIRS Visible infrared Scanner (TRMM)
WMO World Meteorological Organization
 Indoex Home Page