|
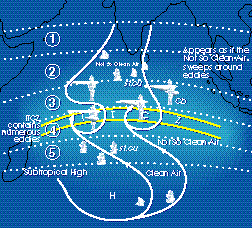
| Figure 13. Low-level cross-equatorial flow during the Asian winter monsoon, and the five atmospheric regions to be measured during INDOEX. |
1. Cloud-free area in the Arabian Sea: direct solar and IR forcing in cloud-free area; concentrations and properties of radiatively active species including aerosols; release of greenhouse gases and release of particulate matter into the lower troposphere below and above the inversion region; and, the evolution (aging) of the Indian plume.
2. Cloud-topped marine boundary layer north of the ITCZ: indirect forcing due to increase in CCN resulting from the aerosol-rich continental air; and vertical distribution of solar radiation in cloudy and clear air.
3. Polluted convective clouds in the ITCZ: vertical cloud processing of aerosols; release of greenhouse gases; release of particulate matter into the tropopause region; and water vapor and ozone greenhouse effects and cirrus shortwave cloud forcing.
4. Less polluted convective clouds in the southern margin of the ITCZ: this region will serve as a reference for region 3.
5. Less polluted cloud-topped marine boundary layer and cloud-free
air south of the ITCZ: this region will serve as the reference for
regions 1 and 2.
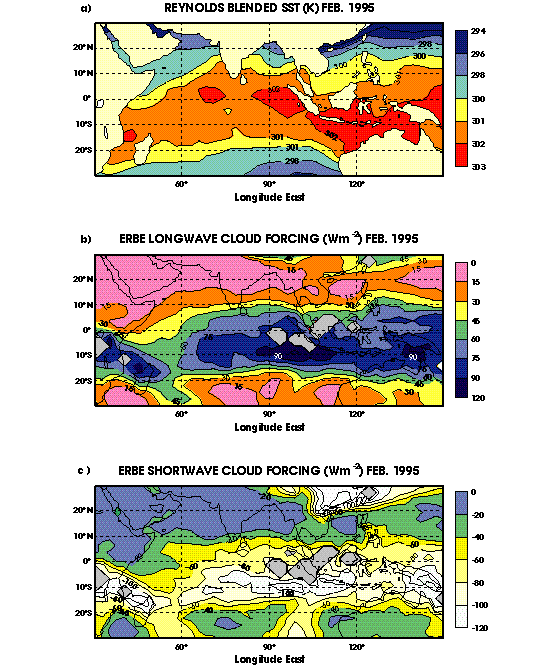
Observations of the gradients and variations across the 5 regions will be used to examine: how the continental air influences gaseous species, aerosols and cloud properties and their radiative forcing; how extended convective-cirrus anvil cloud systems in the ITCZ influence the radiative fluxes at the sea surface; and also, how deep convection affects the distributions of aerosols, H2O, O3 (amongst other species) and the radiative fluxes in the troposphere and lower stratosphere. The experiment design has been influenced strongly by the following pre-INDOEX data and model results: 1) The German cruise data (Figure 8), which reveals a large increase in boundary layer ozone south of India during the NE monsoon; 2) The GCM calculation of sulfate optical depth (Figure 6); 3) Earth Radiation Budget Experiment (ERCLEAR) shortwave cloud forcing (Figure 7); and finally, 4) Data from a pre-INDOEX cruise during February 1995 by INDOEX researchers, from the University of Maryland and the University of Miami (Figures 14a and 14b). The data from the cruise represent a proof of principle of the experimental design based upon north/south gradients of chemical species influenced by continental air. A brief discussion of this cruise is given below.
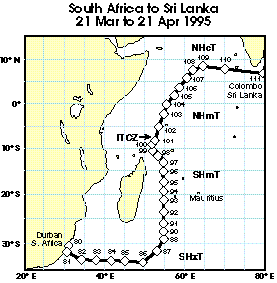 |
| Figure 14a. Ship track and meteorological regimes encountered during the Pre-INDOEX cruise of the NOAA R/V M. Baldrige in March and April 1995. Air masses: SHxT, SHmT, NHmT, and NHcT. Diamond symbols mark locations of sondes released. |
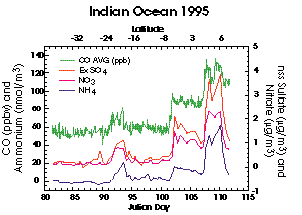 |
| Figure 14b. Variation of trace gases and aerosols during the pre-INDOEX cruise of R/V M. Baldrige. |
This section provides an overview of the experiment location and duration. Specific details vary depending upon the particular platform, each of which is described in Chapter 6. The supporting platforms, especially the satellites, will observe the entire Indian Ocean between 25šS and 20šN, which is the ideal region to observe the changes described earlier. However, the in situ observations from the primary platforms are necessarily limited to a much smaller region and to selected temporal sampling, between about 55šE and 80šE and between 20šS and 15šN. The criteria for the location and the period were provided by the following considerations of the NE monsoon.
The Northeast Monsoon
Data from the Meteorological Atlas of the International Indian Ocean Experiment [MAIIOE, 1972], the Indian Ocean Atlas [IOA, 1976], and the Climate Atlas of the Indian Ocean [CAIO, 1979] illustrate the seasonal cycle of the northeast monsoon. The monsoon develops in late November, and is fully established by December (Figure 15). The low-level flow is predominantly from the north-northeast. In January, this northerly flow in the central and eastern Indian Ocean starts to curve eastward by about 2šS. In February northerly flow is maintained until about 5šS. From November to February, the maximum sustained wind speed is approximately 10 knots, with this speed maximum shifting from the northern to the southern Arabian Sea over the course of the season. During the northeast monsoon season, the ITCZ, identified by a region of light winds of variable direction, moves from around 5šS (November) to 10šS (February). In January and February, the predominant southeast trades of the southern Indian Ocean are not encountered until one moves beyond 15šS.
 |
| Figure 15. Mean surface winds in December for the Indian Ocean. Contours are in ms-1. The flow pattern is an average over the period of 1911-1970 [CAIO, 1979]. |
Minimum cloudiness is found over the Arabian Sea during the northeast
monsoon, extending further south during the transition period in March
and April. In February, total cloudiness is ~10% in the northern
Arabian Sea, changing to 40% in the southernmost Arabian Sea. In the
south, total cloudiness near Mauritius/Reunion remains about 50%
throughout the season. Precipitation is very small, ~10% or less, in
the Arabian Sea during the northeast monsoon. Near Mauritius, values
approach 20% and even 30%. In the ITCZ, near 10šS, values can be
as high as 40%.
During March a building high in the Arabian Sea causes the surface flow to slowly rotate around through the north and west, and by May the southwest monsoon is beginning to establish itself. This seasonal cycle and physical extent of the northeast monsoon dictates the time frame of the INDOEX field phase to be sometime between December to April and the physical location of the long term observation sites to be in the island of Maldives (Malé) and Reunion/Mauritius.
For reasons of proximity to the areas of interest to INDOEX, the island of Maldives (Malé or Gan) is the preferred base for the aircraft. Should detailed analyses of logistics (e.g., lack of adequate ground facilities at the airport) preclude Maldives, the island of Seychelles (4.35šS, 55.3šE) is the alternate choice for the base.
The experimental period will consist of two phases:
* An intensive field phase that will begin on or about January 1, 1998. Intensive surface obser-vations will start on January 1 at Malé and Reunion/Mauritius and will continue for four months until April 30, 1998. Research flights and cruises will commence on February 15, 1998, and will last about six weeks.
* Enhanced observation phase that will range about 1 to 3 years depending on the platform.
Intensive Field Phase (IFP)
The following platforms will be used during the field phase:
* Radiation, microphysics, chemistry, water vapor, precipitation and other meteorological data will be collected from the five aircraft and the two ships.
* Collocated and real time satellite meteorological data from polar-orbiting NOAA and Defense Meteorological Satellite Program (DMSP) satellites and geo-stationary INSAT satellite.
* Earth radiation budget data from the French ScaRaB instrument are important for this experiment.
* In addition, if the TRMM has been successfully launched by then, its rainfall and radiation budget data will significantly enhance the value of INDOEX. Furthermore, the aircraft and ship based radar data can be used as ground truth for validating TRMM estimates of precipitation and surface radiation budget.
* Surface based calibrated measurements of aerosols, radiation, chemistry and soundings at Malé and Reunion/Mauritius will be a vital part of the field phase. Malé will serve as the "control" for the polluted air, while Reunion which is southwest of Maldives, will serve as the "control" for air entering the ITCZ from the southern Indian Ocean.
Enhanced Observation Phase (EOP)
Historical data: ERBE scanner data for 1985 to 1990 and recent ScaRaB data will be analyzed to understand the spatial and temporal evolution of ITCZ cloud systems and their radiative forcing. Ship sondes for the period 1980 to 1990 will be analyzed to estimate the vertical distribution of water vapor across the ITCZ. ISCCP and INSAT radiance (available at NCAR and C4) data for the 1985 to 1990 period will be used to analyze the weekly and longer time scales variability of clouds. Surface aerosol data taken in India will be analyzed.
Analyzed and model fields: Analyzed dynamical fields from the ECMWF, the Laboratoire de Météorologie Dynamique (LMD), and T-106 Florida State models for a period of about two years (for December-April period) will be used to characterize the transport properties and the variation in the monsoonal inversion.
Extended experimental phase: i) We also envisage a strong need for a buoy in the ITCZ to monitor surface winds, humidity, SST, rainfall and radiation fluxes, in the domain of interest. Such observations are needed for periods of at least two years, one year before and one year after the experiment and also during the experiment. Automated ground measurements (e.g., column aerosol optical depth, ozone, radiation fluxes) at Malé and Reunion/Mauritius will be maintained for the three year period; and ii) A four month long (including the 6 to 8 week field phase) calibrated set of observations from the two island sites will be collected, including water vapor and ozone sondes, vertical distribution of aerosols and winds from a profiler. In addition, since very little is known about this region, pre-INDOEX cruises will be required to ensure the success of the experiment. The following activities are underway:
* As described earlier in this chapter, an exploratory experiment was conducted in the Indian Ocean from the NOAA's R/V M. Baldrige during early 1995.
* MPIC is making surface ozone measurements from a merchant ship over the domain of interest (Figure 8).
* The National Physical Laboratory (NPL-New Delhi) and C4 conducted a cruise which undertook measurements of water vapor, ozone, aerosols and radiation fluxes on board the Indian R/V Sagar Kanya during January 4 to February 3, 1996.
* Another Sagar Kanya cruise has been planned for December to January 1997.
Models will play a substantial role in the design of the experiment and
in the post-field phase analysis. Atmospheric GCMs and three
dimensional transport models will be employed to guide the experimental
design and plan. Participation by five modeling groups at Florida
State University (FSU), University of Utrecht, LMD, MPIC and NCAR will
facilitate access to these models, all of which perform monsoon
simulation as well as simulate the transport of trace species including
sulfates. One example of this simulation is Figure 16, which shows
parcel trajectories of an inert trace gas with sources from various
cities in India. In addition, C4 (NCAR, MPIC and Scripps
Institution of Oceanography, SIO) has developed an equatorial chemistry
model. This model, which is currently being validated with CEPEX data,
will be used to simulate the chemistry of reactive species in the
Indian Ocean. Another example of a pre-field phase model study is one
by LMD, which is currently undertaking the analysis of the NE monsoon
and its transition to SW monsoon in an ensemble of simulation,
including one 10-year Atmospheric Models Intercomparison Project (AMIP)
simulation, and an ensemble of 16 independent 4-year simulations of the
1986-1989 period (Figure 17).
 |
| Figure 16. Trajectory Calculation. The trajectory starting points are located in the middle of the boundary layer to stimulate pollution transports from 4 major source regions in India: Madras, Bombay, Calcutta and New Delhi. The trajectories, calculated 18 hours apart from January 1 to April 30, are grouped according to starting hour (GMT) per month. The trajectories are marked by their starting date and time (e.g., 93032012 is 20 March 1993 at 12 GMT). (Courtesy of the Royal Netherlands Meteorological Institute) |
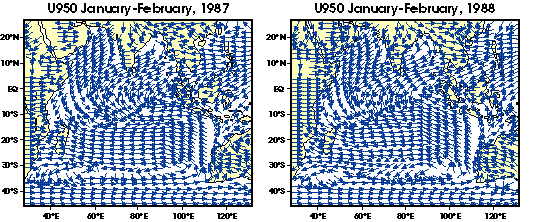 |
| Figure 17. January-February average wind velocities at 950mb for 1987 (left) and 1988 (right), from an ensemble average of 16 independent four-year simulations of the 1986-1989 period with the LMD Atomospheric GCM forced by observed SST's. (Courtesy of R. Sadourny and A. Harzallah) |
Design of the Integrated Data System
A complete examination of the various processes involved under the three objectives (Table 2) can only be done with complex sophisticated models of aerosols, clouds, radiation, chemistry and GCMs. These models and their parameterizations must be validated with observations. Data collected from the composite observing system must facilitate such validation. The data from the primary platforms must be combined with the data from the supporting platforms to extend to time and space scales relevant for climate and transport models.
The limited sampling of six to 12 weeks during the 6 weeks of IFP and 4 months of extended experimental phase will be used as "ground truth" for the roughly two years of data from the buoy, island stations and satellites. Selected examples are given below:
* Use the results of IFP aircraft data for aerosol physical, chemical and optical properties to refine satellite retrieval algorithms for aerosol optical depth and albedo. These will also provide quantitative links to measured key aerosol types (e.g. dust and sulfate) that can be used to characterize their distribution throughout the Indian Ocean region.
* Use the continuous sampling from Malé and Reunion/Mauritius to assess the seasonal variation in aerosols, radiation fluxes, cloud forcing, ozone, water vapor distribution, precipitation and clouds. The island data also provides the ground truth for satellite retrievals of optical depth and cloud/aerosol radiative forcing.
* Two years of island and buoy data for surface solar radiation flux and collocated satellite radiances will be used to develop algorithms that relate top-of-atmosphere fluxes to surface shortwave fluxes for land and open ocean regions. These validated algorithms will then be used to extend the IFP cloud forcing and tropospheric solar absorption to the entire low latitude (25šS to 20šN) Indian Ocean.
The 2 to 3 year validated data sets, in addition to meeting INDOEX objectives, will enable the following studies:
* The equatorial Indian Ocean is one of the most active tropical ocean basins. INDOEX will provide a unique opportunity to monitor the tropical wave and cyclones over the data void region.
* The 2 to 3 year data sets would be used to validate the analyzed fields from ECMWF and FSU for the INDOEX period. Thus INDOEX can provide useful benchmark for Climate Variability and Predictability Program (CLIVAR) studies of low frequency variability.
The key task then, is the integration of the various platforms with satellite data. The observations from INDOEX will be integrated using a proven system designed for CEPEX. The C4 Integrated Data System (CIDS) was designed to facilitate interdisciplinary research by providing a common interface to complex and heterogeneous data sets. It distinguishes itself from other data base management systems by automatically collocating and merging measurements from arbitrary sets of observing platforms. Although CIDS was originally developed to store data from CEPEX, the software is being generalized to handle other data as well. Applications have already been written to ingest measurements from buoys, atmospheric soundings, ships, and aircraft into the system. Similar applications have been developed to ingest GCM output into CIDS through the ongoing C4 and Atmospheric Radiation Measurement (ARM) collaborations. The use of CIDS will eliminate much of the programming effort normally associated with calculating derived quantities (e.g. radiation fluxes from observed input) from heterogeneous sets of measurements (e.g., SST and vertical profiles of temperature and humidity). The integration effort will be lead by C4.
A number of national and international programs have been initiated to address the aerosol-climate, chemistry and climate change issue (Table 5). The design of the INDOEX program will take great care to avoid duplication. Furthermore, INDOEX measurements should complement the objectives of these programs. In addition, the Global Energy and Water Cycle Experiment (GEWEX) Asian Monsoon Experiment (GAME) has been planned to be in operation during the proposed INDOEX. This large program will focus on the Asian monsoons and the surface hydrological process (GAME Planning Document, 1993).
|
||||||||||||||||||||||||||||||||